GBP/USD 5M Analysis
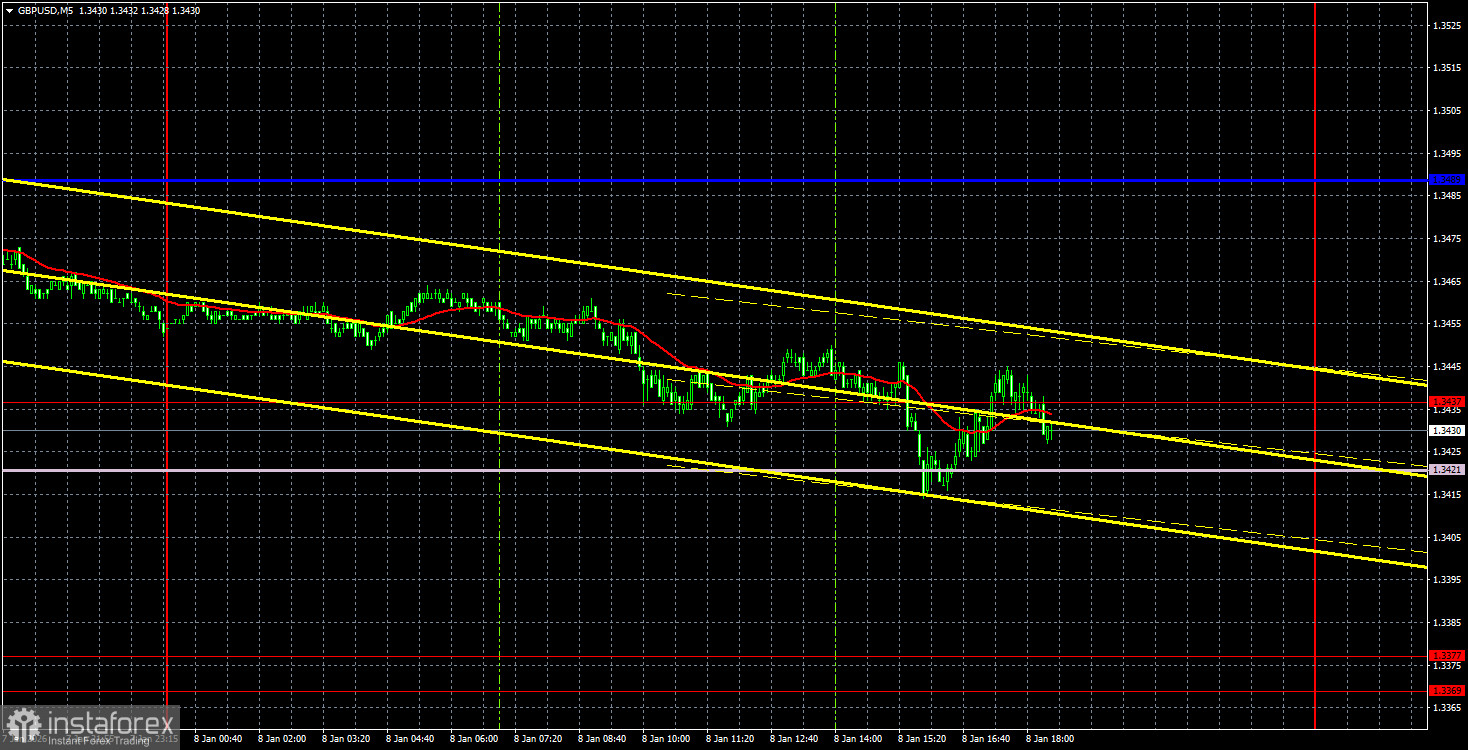
The GBP/USD currency pair, unlike EUR/USD, continues to maintain an upward trend. Over the past few days, the British currency has also declined, but this does not give the impression of a downtrend. The pound has returned, on shaky ground, to support in the form of the 1.3421–1.3437 level, which previously prevented the pair from continuing its decline twice. Thus, a third attempt to move south may also end in failure.
Let us recall that we do not consider the fundamental and macroeconomic background this week to be favorable for the dollar—neither events related to Trump nor U.S. macroeconomic data. Therefore, what we are observing may be a purely technical correction. For now, the price is also unable to move below the Senkou Span B line.
This week, only the Non-Farm Payrolls and the unemployment rate remain to be released; however, "to get through" them is a bit of an overstatement. Throughout the week, the market has shown a complete unwillingness to trade, and volatility continues to fall even in the traditionally active pound. Today, at the beginning of the U.S. trading session, market movements may be absolutely unpredictable, as traders will react to important reports—assuming they react at all rather than ignore them.
On the 5-minute timeframe, the last trading signal was formed on Wednesday, when the price broke through the critical line. Traders who opened short positions based on this signal could have made a profit of about 40 points on Thursday. A clear rebound from the 1.3421–1.3437 level has not yet occurred, so at the moment it is unclear in which direction the pound will trade on Friday.
COT Report
COT reports on the British pound show that in recent years the sentiment of commercial traders has been constantly changing. The red and blue lines, which represent the net positions of commercial and non-commercial traders, frequently intersect and in most cases remain close to the zero level. At present, the lines are diverging, but non-commercial traders are currently dominating—with selling positions. Speculators are increasingly selling the pound, but as we have already said, it does not matter how low demand for the British currency is; demand for the U.S. dollar is often even lower.
The dollar continues to decline due to Donald Trump's policy, which is clearly visible on the weekly timeframe (see illustration above). The trade war will continue in one form or another for a long time, and the Federal Reserve will in any case cut rates over the next 12 months. Demand for the dollar will decrease one way or another. According to the latest COT report (dated December 23) on the British pound, the "Non-commercial" group opened 1.6 thousand buy positions and closed 5.7 thousand sell positions. Thus, the net position of non-commercial traders increased by 7.3 thousand over the week.
In 2025, the pound has risen quite strongly, but it should be understood that there is only one reason—Donald Trump's policy. As soon as this factor is neutralized, the dollar may begin to rise, but no one knows when that will happen.
GBP/USD 1H Analysis
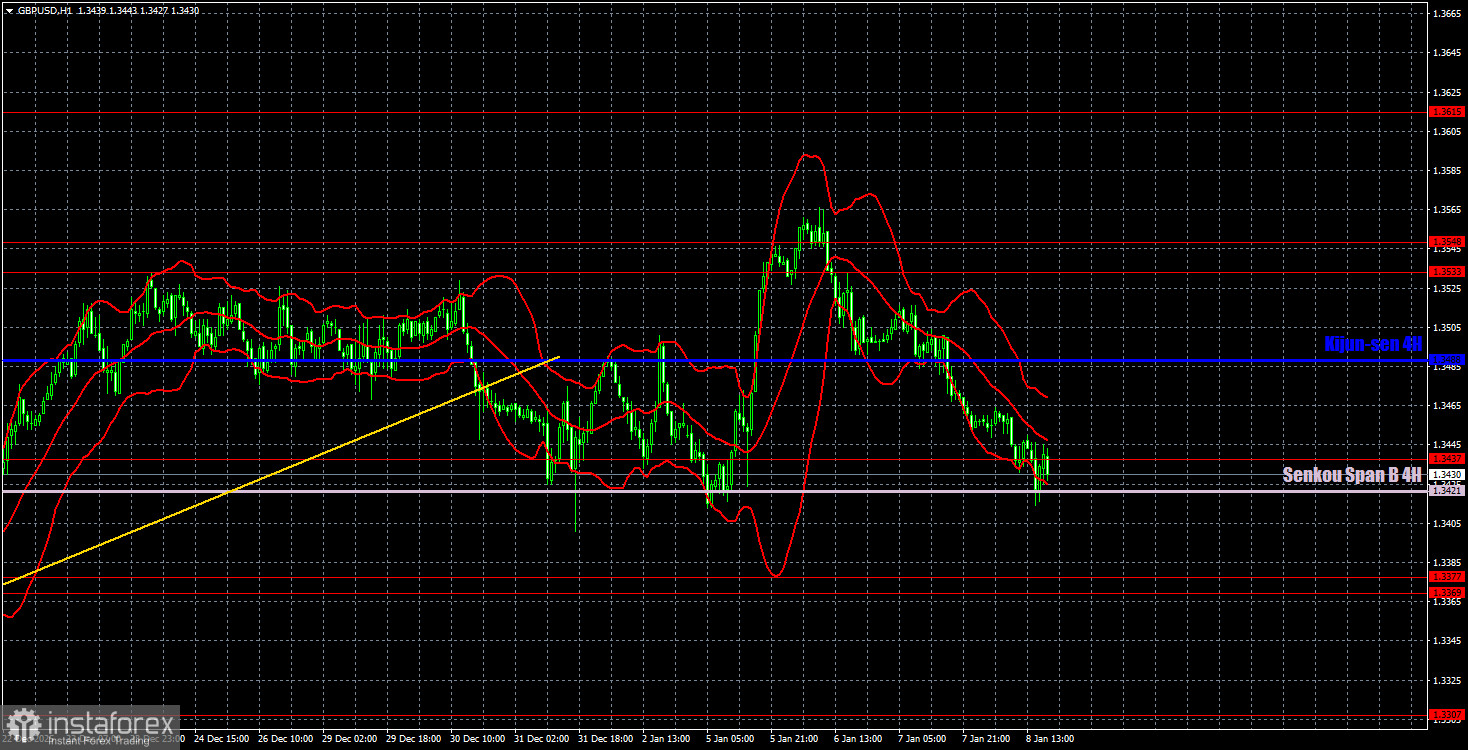
On the hourly timeframe, the GBP/USD pair continues to form an upward trend despite breaking the trend line. We believe that the growth of the pound sterling in the medium term will continue regardless of the local macroeconomic and fundamental background. The Senkou Span B line is preventing the price from falling below it, which signals the preservation of a local upward trend.
For January 9, we highlight the following key levels: 1.3042–1.3050, 1.3096–1.3115, 1.3201–1.3212, 1.3307, 1.3369–1.3377, 1.3437, 1.3533–1.3548, 1.3615, 1.3681, 1.3763. The Senkou Span B (1.3421) and Kijun-sen (1.3488) lines may also serve as signal sources. It is recommended to move the Stop Loss to breakeven once the price moves 20 points in the correct direction. Ichimoku indicator lines may shift during the day, which should be taken into account when identifying trading signals.
On Friday, no important publications or events are scheduled in the United Kingdom, while in the United States reports will be released that the market may have been waiting for since the beginning of the week. These reports can be called the most important events of January, as the future monetary policy of the Federal Reserve will depend on them. However, whether there will be a noticeable reaction to the Non-Farm Payrolls and the unemployment rate is a very big question.
Trading Recommendations
Today, traders may consider selling if the price consolidates below the 1.3421–1.3437 level, with a target of 1.3369–1.3377. Long positions will become relevant if the price rebounds from the 1.3421–1.3437 level, with targets at the critical line and 1.3533–1.3548.
Explanations to the Illustrations
- Support and resistance levels – thick red lines near which price movement may end. They are not sources of trading signals.
- Kijun-sen and Senkou Span B lines – Ichimoku indicator lines transferred to the hourly timeframe from the 4-hour timeframe. They are strong levels.
- Extreme levels – thin red lines from which the price previously rebounded. They are sources of trading signals.
- Yellow lines – trend lines, trend channels, and any other technical patterns.
- Indicator 1 on COT charts – the size of the net position of each category of traders.