Analyzing Friday's trades:
GBP/USD on 30M chart
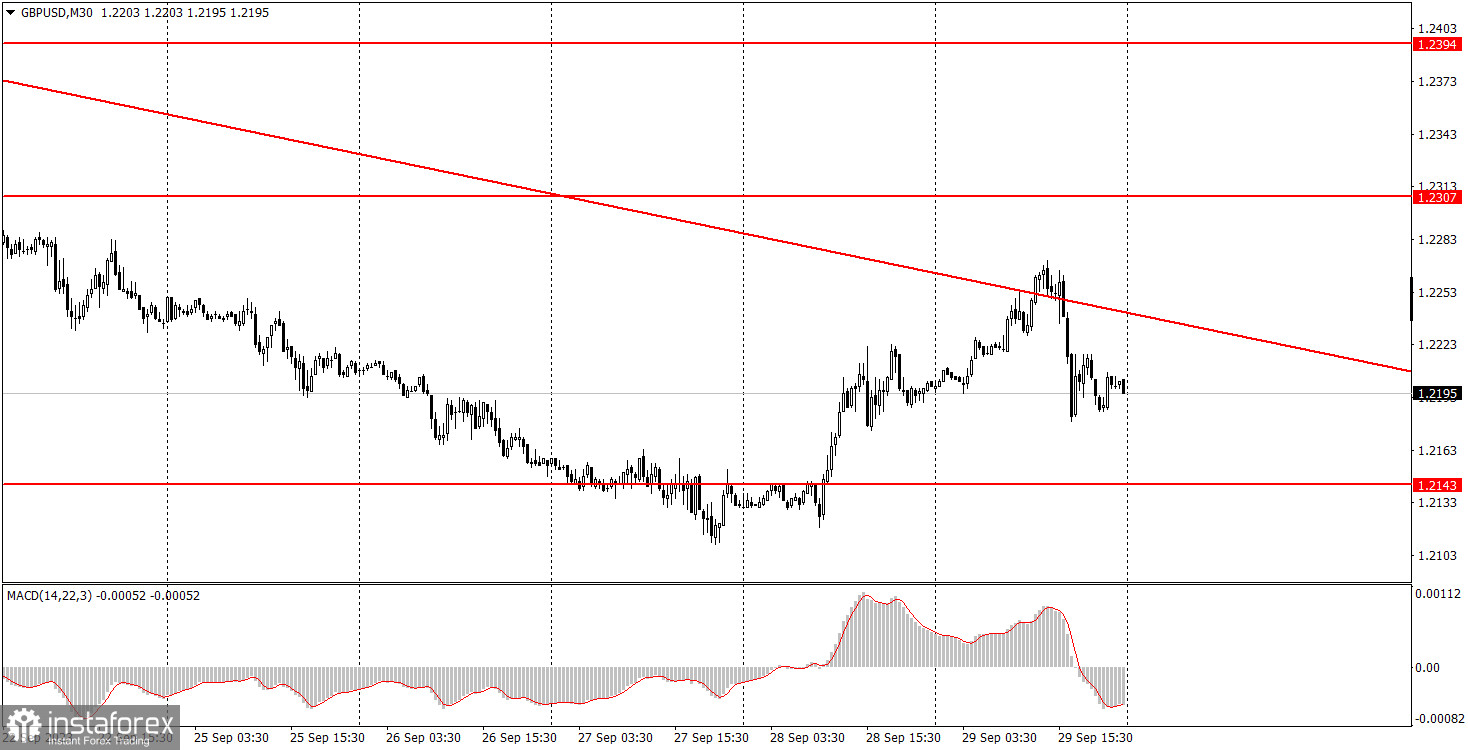
GBPUSD continued its bullish correction on Friday, but it also started to fall in the second half of the day. Let's try to understand why this happened. First of all, a corrective scenario does not imply the absence of bearish corrections. Everything that happened on Friday was a simple pullback after two days of growth. The British pound is still too weak and can resume its downward movement at any moment.
Secondly, Friday's macro data did not support the pound. However, US reports did not particularly support the dollar either. Nearly all of the reports were neutral, so traders could either ignore them or interpret them as they wished. We believe that the pair's movements could be best described as "random." The downward trendline was broken once again, but the pair may continue to correct higher.
GBP/USD on 5M chart
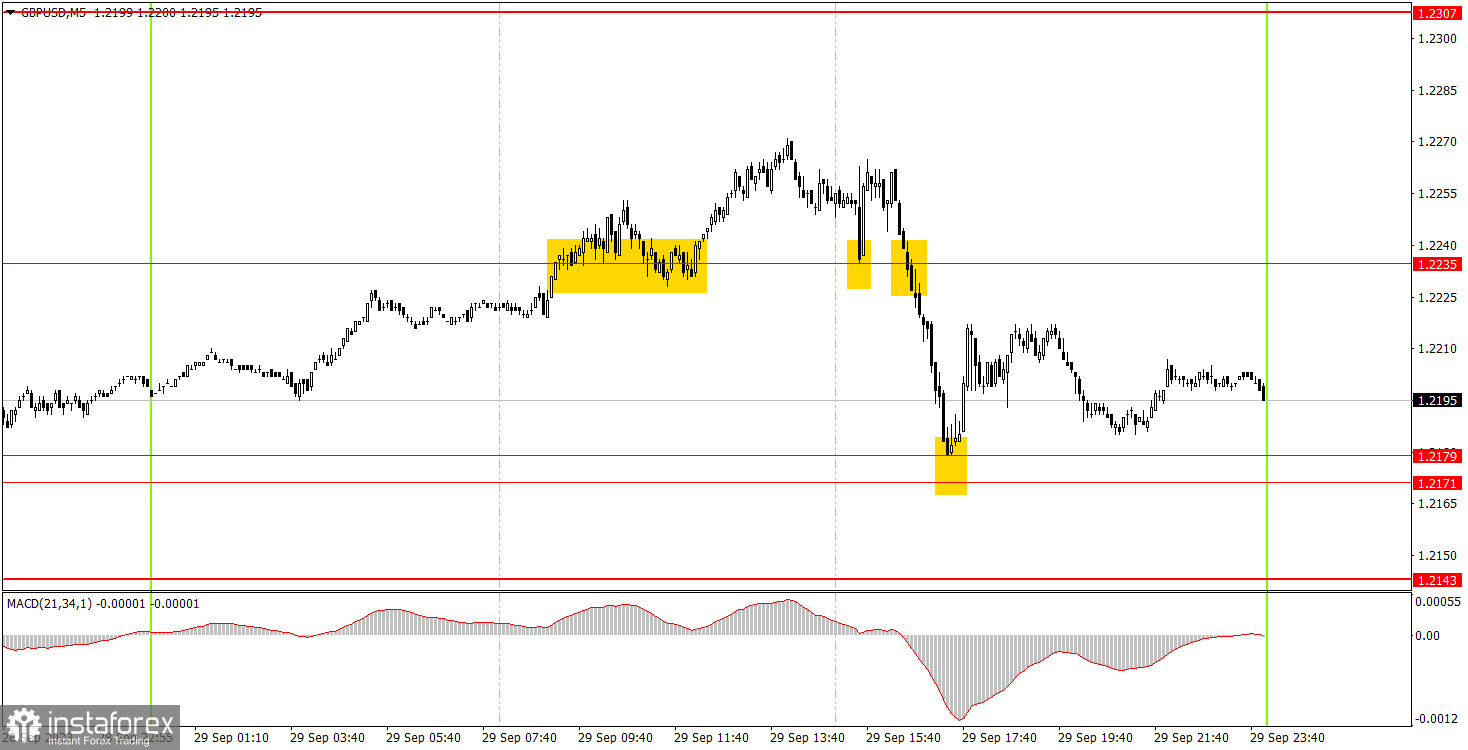
The 5-minute chart showed that volatility was good so the trading signals were quite interesting. The first buy signal was generated when the pair surpassed the level of 1.2235, but it only managed to rise by 23 pips, which was enough to set stop loss at breakeven, at which point the trade closed. Then there was another bounce from the level of 1.2235, which was clearly triggered by the release of US data (it coincided in time), but it did not provoke a strong reaction or an upward movement.
The second false signal should not have been executed because the price moved away from the level of 1.2235. The next sell signal was quite good, but beginners had to decide whether to execute it or not. In case of a positive response, the profit from the short position was about 20-25 pips, and the bounce from the level of 1.2179 could have been used to open long positions, which brought in another 10-15 pips.
Trading tips on Monday:
On the 30-minute chart, GBP/USD continues its corrective move, as we warned in advance. The pound may trade higher for quite some time, even without specific fundamental and macroeconomic reasons behind it. After that we expect it to resume its decline as we believe that the balance between the pair is not fully restored yet. The key levels on the 5M chart are 1.1992-1.2008, 1.2065-1.2079, 1.2143, 1.2171-1.2179, 1.2235, 1.2307, 1.2372-1.2394, 1.2457-1.2488, 1.2544, 1.2605-1.2620, 1.2653, 1.2688. Once the price moves 20 pips in the right direction after opening a trade, you can set the stop-loss at breakeven. On Monday, Manufacturing PMIs will be published in the UK and the United States. You should pay close attention to the US ISM index. Federal Reserve Chair Jerome Powell is also scheduled to speak.
Basic trading rules:
1) The strength of the signal depends on the time period during which the signal was formed (a rebound or a break). The shorter this period, the stronger the signal.
2) If two or more trades were opened at some level following false signals, i.e. those signals that did not lead the price to Take Profit level or the nearest target levels, then any consequent signals near this level should be ignored.
3) During the flat trend, any currency pair may form a lot of false signals or do not produce any signals at all. In any case, the flat trend is not the best condition for trading.
4) Trades are opened in the time period between the beginning of the European session and until the middle of the American one when all deals should be closed manually.
5) We can pay attention to the MACD signals in the 30M time frame only if there is good volatility and a definite trend confirmed by a trend line or a trend channel.
6) If two key levels are too close to each other (about 5-15 pips), then this is a support or resistance area.
How to read charts:
Support and Resistance price levels can serve as targets when buying or selling. You can place Take Profit levels near them.
Red lines are channels or trend lines that display the current trend and show which direction is better to trade.
MACD indicator (14,22,3) is a histogram and a signal line showing when it is better to enter the market when they cross. This indicator is better to be used in combination with trend channels or trend lines.
Important speeches and reports that are always reflected in the economic calendars can greatly influence the movement of a currency pair. Therefore, during such events, it is recommended to trade as carefully as possible or exit the market in order to avoid a sharp price reversal against the previous movement.
Beginners should remember that every trade cannot be profitable. The development of a reliable strategy and money management are the key to success in trading over a long period of time.