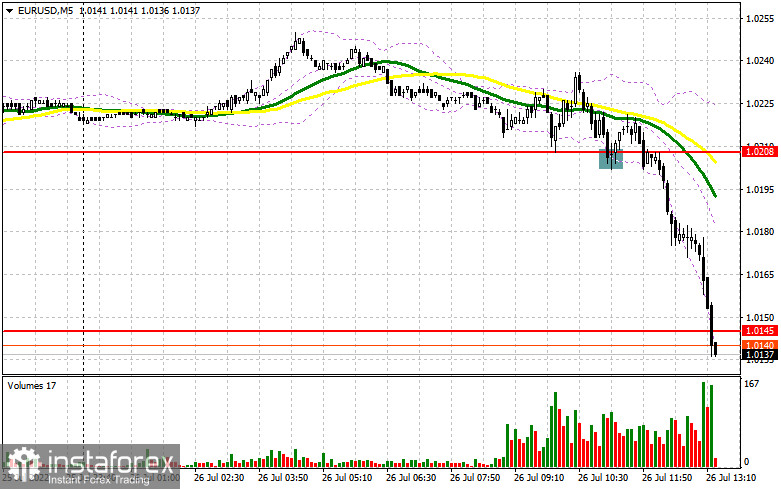
I paid close attention to the 1.0208 level in my morning forecast and suggested making entry decisions there. Let's examine the 5-minute chart to determine what transpired there. The slide to the region of 1.0208 and a false breakdown in the absence of significant fundamental statistics – all of this maintained the dream of future euro appreciation alive and signaled the opening of long positions. Sadly, after gaining 10 points, the pressure on the pair resumed, and a decline to 1.0208 occurred. As a result, losses were recorded for the transaction. There has been a shift in the technical situation in the afternoon.
To initiate long positions on the EURUSD, you must:
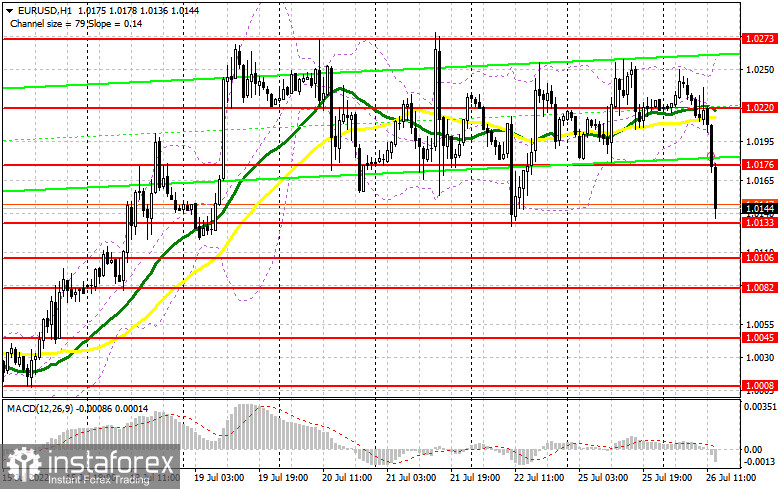
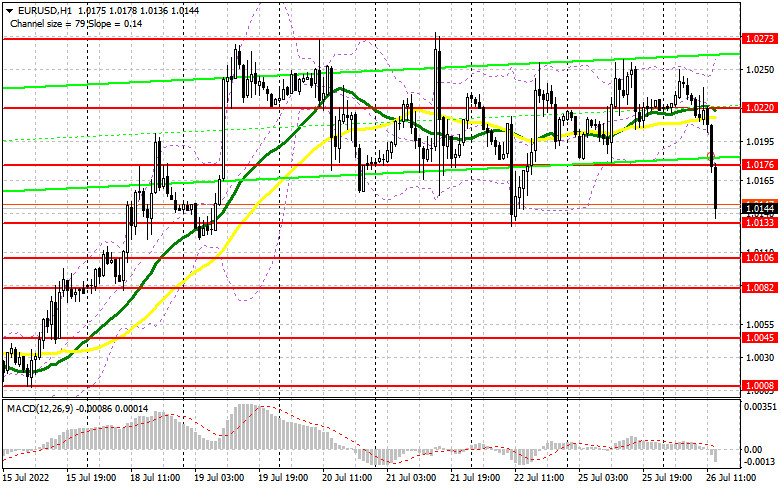
Intriguing information is anticipated on the indicator of consumer confidence in the United States and the volume of house sales in the primary market in the United States. And suppose all is obvious with the second component. In that case, there will undoubtedly be a decline owing to high-interest rates – then positive consumer confidence data can further support the US dollar, putting pressure on the pair. In this context, I anticipate a decrease in the euro and advise establishing long positions only after updating and generating a fake breakdown in the new support area at 1.0133, which coincides with last week's lows. In this case, a correction to 1.0176 (a new resistance built by the outcomes of the first half of the day) is likely. A breakthrough and a top-down test of this area will trigger the stop orders of the bears, signaling the entry of long positions with the potential for a rise above last week's high of 1.0273. Only after tomorrow's meeting of the Federal Reserve System will it be able to leave this region. The more distant objective will be the area around 1.0323, where I advocate locking in profits. If EUR/USD falls and there are no buyers at 1.0133 in the afternoon, the euro will come under increased pressure. In this instance, I would advise against rushing into the market: the ideal entry point for long positions would be a false breakdown in the vicinity of 1.0106. I recommend purchasing EUR/USD immediately for a comeback only from the level of 1.0082, or even lower - around 1.0045, with the goal of a 30-35-point intraday upward correction.
To establish short positions on the EURUSD, you must:
In the event of further decrease, bears should appear in the 1.0133 area of support. But given how far we've fallen from the opening level and how significant this range is, I advise you not to sell there in anticipation of a collapse. In the case of negative US statistics and a dramatic decrease in consumer mood, the ideal scenario would involve short positions with a euro correction to the range of 1.0176. Only the development of a fake breakdown at 1.0176 signals the opening of short bets in anticipation of a EUR/USD slide to the 1.0133 support level. A breakdown and consolidation below this range, as well as a reverse test from the bottom up, will result in an additional sell signal with the destruction of buyers' stop orders. Moreover, a larger pair movement down to the 1.0106 area will significantly impact speculative traders who expect the pair to remain within the side channel until the Fed meeting. However, remember that the negative trend following the retest of 1.0106 should be swift; otherwise, bulls will attempt to offset losses around the middle of the American session. Fixing below 1.0106 is a direct route to 1.0082, at which point I advocate abandoning sales entirely. The 1.0045 region will serve as a further-off objective. A retest of this level would indicate a continuation of the bearish trend. If there is a rise in EUR/USD during the American session and the absence of bears at 1.0176, I recommend delaying short positions until a more attractive 1.0220 resistance level. Only the emergence of a fake breakdown there will mark the beginning of the euro's selling. Short positions can be reopened immediately from the maximum of 1.0273, or even higher – around 1.0323, with the objective of a 30-35 point correction below.
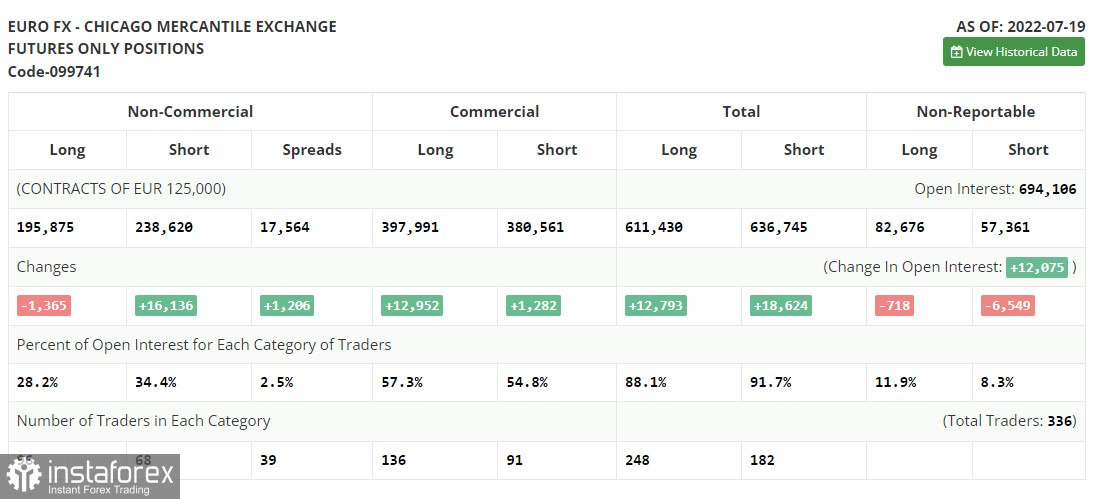
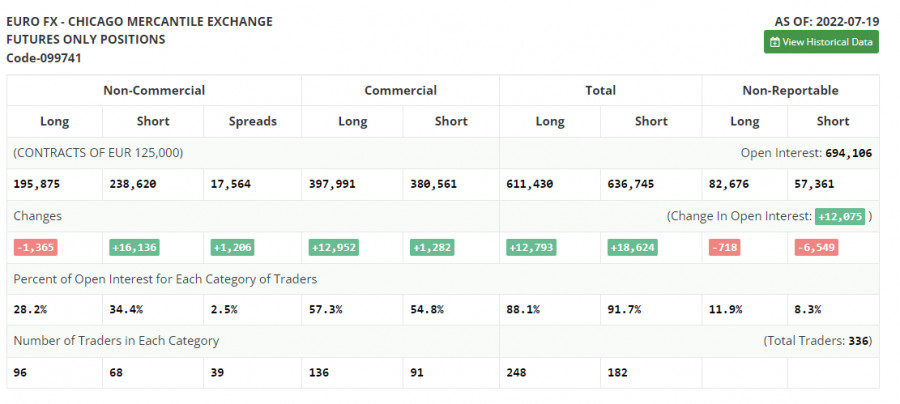
The July 19 COT report (Commitment of Traders) showed a rise in short holdings and a decrease in long positions, indicating a continuation of bearish sentiment in the market. This also resulted in establishing a larger negative delta, which shows that there are still fewer buyers than may be expected. The European Central Bank boosted interest rates by 0.5 percent last week, which exceeded expectations of 0.25 percent. This illustrates the severity of the inflation issue in the eurozone. However, the markets responded negatively to this decision, and traders adopted a wait-and-see stance before the midweek release of the conclusions of a crucial Federal Reserve System meeting. There are no actual reasons for EUR/USD to strengthen, such as rising inflation, an energy market crisis, and an economy swiftly falling into recession. Thus it is likely that risky assets will continue to depreciate in the following months. According to the COT data, long-term non-commercial jobs declined by 1,365 to 195,875, while short non-commercial positions increased by 16,136 to 238,620. After the week, the total non-commercial net position remained negative at -42,745 vs. -25,244. The weekly ending price increased slightly from 1.0094 to 1.0278.
Signals of indicators:Moving AveragesTrading occurs below the 30-day and 50-day moving averages, indicating the emergence of a new bear market.The author considers the period and prices of moving averages on the hourly chart H1, which differs from the standard definition of daily moving averages on the daily chart D1.Bollinger BandsThe indicator's upper limit near 1.0265 will act as resistance in an upward trend.Description of indicators
- Moving average (moving average determines the current trend by smoothing out volatility and noise). Period 50. The graph is marked in yellow.
- Moving average (moving average determines the current trend by smoothing out volatility and noise). Period 30. The graph is marked in green.
- MACD indicator (Moving Average Convergence / Divergence - moving average convergence/divergence) Fast EMA period 12. Slow EMA period 26. SMA period 9
- Bollinger Bands (Bollinger Bands). Period 20
- Non-profit speculative traders, such as individual traders, hedge funds, and large institutions use the futures market for speculative purposes and to meet certain requirements.
- Long non-commercial positions represent the total long open position of non-commercial traders.
- Short non-commercial positions represent the total short open position of non-commercial traders.
- Total non-commercial net position is the difference between the short and long positions of non-commercial traders.